19/9/25 Prices
At 13.1mt US wheat export sales (5.477mt Outstanding + 7.623mt Shipped) are the best they have been for this time in their marketing year as they have been in the last 5 years. Back in 2019 – 2021 Australia was suffering through a 1-100 year drought, the worst drought in history. In 2019-20 Australia produced almost 20mt less wheat than what is expected to be produced in 2025-26.
The latest surge in US wheat exports has nothing to do with filling supply shorts. It is price driven, from both a tariff bullying perspective, and from lower US values. This will continue to make US wheat very attractive in the short to mid term, not only to their traditional trading partners, but also to new counter parties or old counter parties that have not recently done a lot with them.
The USDA data for US wheat notes an ending stocks number of 22.96mt, domestic usage and exports are 31.41mt + 24.49mt = 55.9mt, a stocks to use ratio of 41%. Looking at Australia the same math will result in a stocks to use ratio of 15.7%, Canada 12%, Russia 13.2%, Ukraine 8.7%, Argentina 20.4%. You start to realise that the current US sales pace may be a good thing in the longer term, and could result in a decline in the US stocks to use ratio, which in turn will help world wheat prices higher longer term.
The basic math to see US ending stocks back under 20%, usage, exports or domestic, would need to increase by as much as 10mt. Currently their average weekly wheat export sales pace is about 899kt ( 13.1mt / 14.57 weeks), versus a projected annual weekly average export sales pace used by the USDA of about 470kt. In order to get ending stocks down to sub 20%, weekly export sales over a year would need to average 664kt.
This may not have a huge impact on the global stocks to use ratio, but it will have a big impact on the stocks to use ratio of the major exporters and obviously the USA.
Is this the cliche “low prices fix low prices” at work, potentially. It may also help explain why Russia is not actively pushing exports at present.
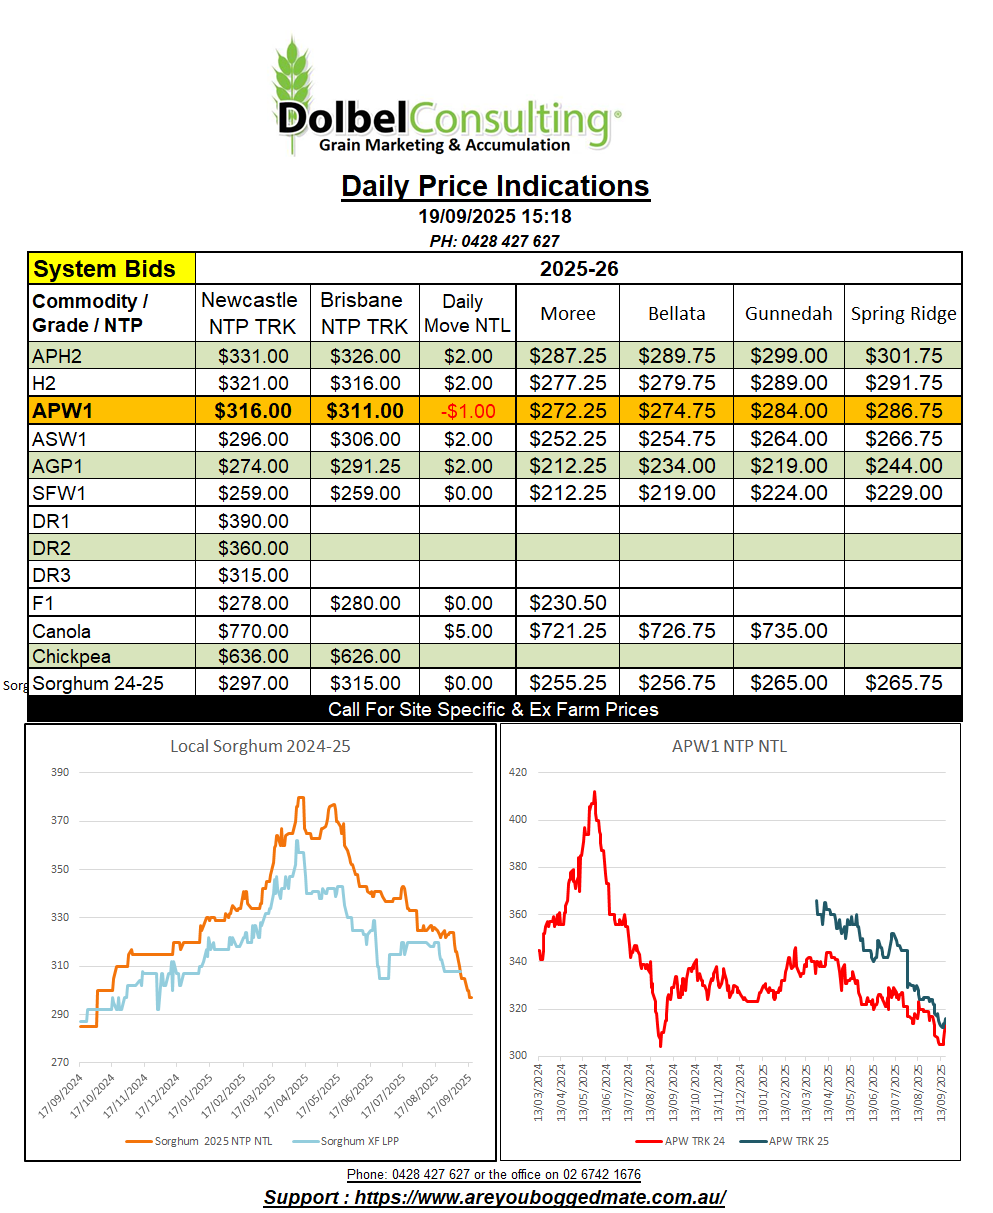
Local markets remain stagnated, little supply on the old crop side is being met by an equal amount of demand, minimal. The SFW1 / ASW1 bid into the local feed market improved a little yesterday. There’s a bunch of grower resistance at current values for both old and new crop. To see harvest selling there may need to be an improvement in bids.
This may come as international markets move away from their harvest period, but there’s a lot at play this year. The slow export programs out of Europe and Russia and the fast wheat export program from the USA to mention a couple. The water is very muddy lately, and comparing apples with apples is getting harder. Today I’ll endeavour to build a simple to read spreadsheet that compares international CnF values for milling wheat that considers the tariffs of each on the possible importers of wheat.
Comparing FOB values for international wheat sellers is useful but it does not tell us what that price is actually “worth” to a consumer. Once we compare apples to apples we will get a better understanding of what true export parity is.
It’s like what we are doing when comparing Aussie and US sorghum into China. FOB and CnF US sorghum may look cheaper but once that tariff is put on top of the US price we start to see the potential top side for Aussie sorghum into the Chinese market. The same goes for Argentine and Brazilian sorghum into China. We start to get a feel for caps and floors and where bids “should” be landing, or at least where offers to sell should be starting.
With the AUD -0.63% this morning it is starting to look like the dollar rally was a buy the rumour / sell the fact rally. Hopefully this continues into next week and we see a little more weakness against the USD. Last night’s move in the AUD is worth -3c/bu in US wheat futures, almost countering their decline.