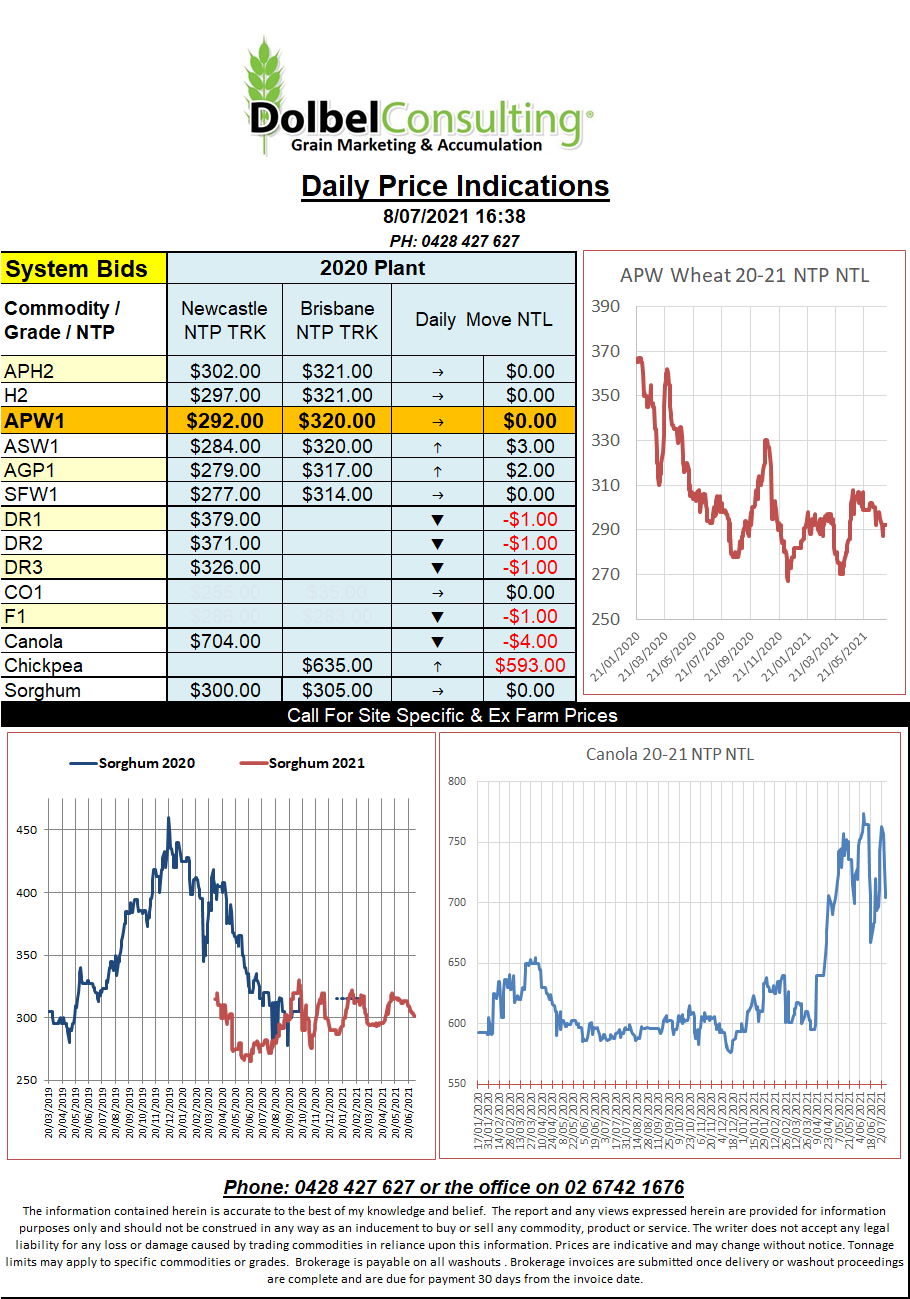
8/7/21 Prices
In the USA the prospect of lower corn area was countered by a good weather map. The trade will probably look to square up somewhat ahead of Monday USDA WASDE report.
The numbers released of late tell me that US corn production is likely to come in somewhere around 364.3mt. The June WASDE pegged US corn production at 380.76mt. To see that happening average yields would need to be historically very good.
With the higher yielding states generally seeing the lion’s share of the rain this season, this is plausible but there are also a number of states that will have very poor corn crops. The big question is will the poorer yielding states pull down the national average enough to sustain current prices or will lower production estimates on Monday’s WASDE rally the market.
I’ve attached an ugly overlay of the 14 day US rainfall and a US corn production map. One obvious issue I see straight away is that Iowa, a state responsible for about 17% of the US corn crop, hasn’t seen the rainfall the eastern / southern corn belt has seen. One would think that in order for the US to perform to a historically high yielding level Iowa would be key. In fact around 1/3rd of the US corn crop has only seen average rainfall, thus prompting one to think an average yield of over 175b/ac might be a stretch…….. and……. just like that I’ll be wrong.
Cash bids across SE Saskatchewan were firmer across the board. For a December lift we see spring wheat up C$4.31, durum up, well not much really but an 8c rally per tonne is better than a fall. Canola was sharply higher, up C$18.84 in Dec with the average bid at C$766.60 XF.